Section 6: Wallet Page
Goal: Provide a clear view of a wallet’s portfolio, activity, and metrics.
The wallet page surfaces key information about a user and their market behavior.
It’s organized into four sections for fast analysis: Overview, Portfolio, Activity, and Metrics.
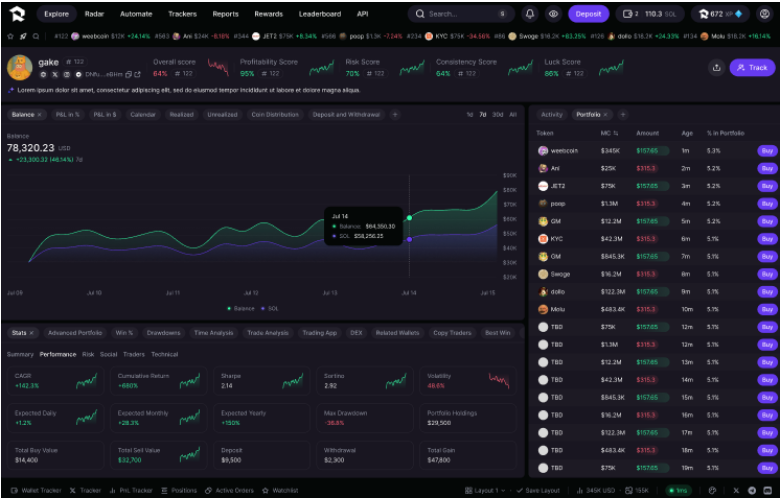
Header Section
The header presents key trader identification details and a concise performance summary.
It includes verified social media accounts and handles, providing context and authenticity for each profile.
Prominently displayed are all quantitative scores generated by RAX’s proprietary algorithms, offering an immediate snapshot of the trader’s overall performance and risk profile.
These scores serve as quick reference points for evaluation, while in-depth explanations and methodologies are detailed in the Trader Metrics chapter.
Dynamic Metrics
The Dynamic Metrics section delivers real-time quantitative insights into trader performance through key financial indicators.
It features continuously updated metrics such as cumulative Profit & Loss (PnL), portfolio distribution, and deposit/withdrawal volumes, enabling users to assess alpha generation and capital flow patterns as they evolve.
This section provides an instant, data-driven perspective on how traders perform under live market conditions.
Portfolio & Activity Overview
The Portfolio & Activity section provides a comprehensive overview of a trader’s current holdings and recent market actions.
It displays real-time portfolio composition across cryptocurrencies, including current values, percentage allocations, and unrealized gains or losses.
Below the portfolio snapshot, users can explore a detailed trade history—complete with buy/sell transactions, entry and exit prices, trade sizes, and timestamps—to understand execution patterns and timing decisions.
Together, these views enable users to analyze both the trader’s active positions and the strategic rationale behind recent activity.
Advanced Metrics
The Advanced Metrics section converts historical trading data into deep analytical dashboards that uncover behavioral and strategic insights.
This suite visualizes long-term patterns such as risk-adjusted returns, trading frequency, preferred platforms and DEXs, and strategy-level characteristics including asset class focus and position sizing tendencies.
Key indicators include Sharpe ratios, maximum drawdown, time-of-day trading heatmaps, and platform distribution charts.
By revealing how, when, and where traders operate, these analytics provide a behavioral profile that complements the real-time perspective of Dynamic Metrics—offering a full-spectrum understanding of trader performance.